Endpoint Detection and Response is a security mechanism that safeguards devices by providing enhanced monitoring and responding to potential sophisticated threats.
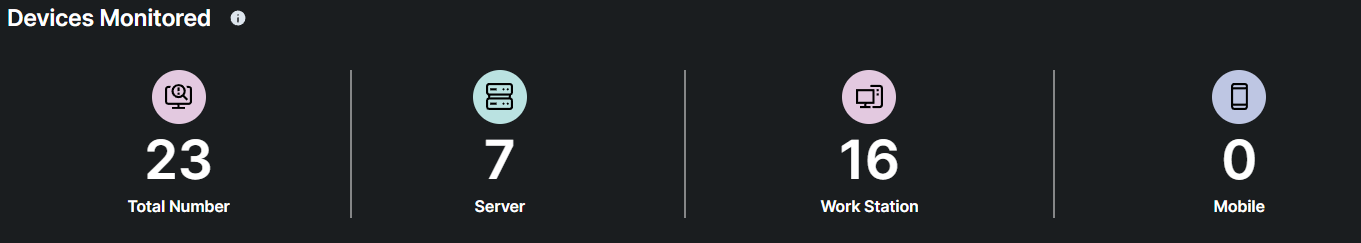
The total number of devices currently being tracked and protected by malicious threats
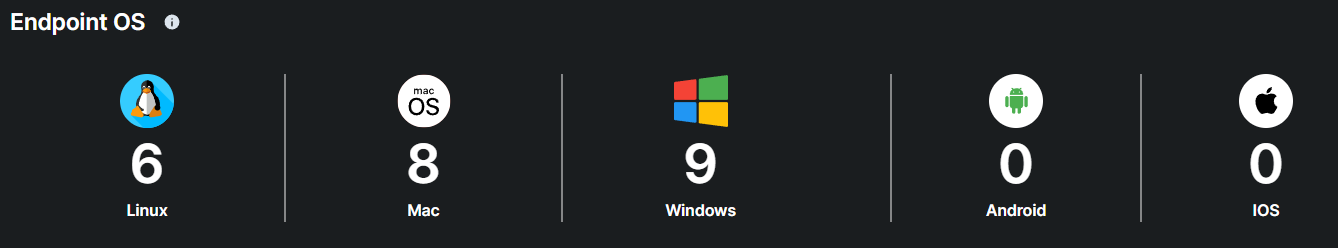
The total number of endpoints currently being tracked and protected, broken down by operating system type.
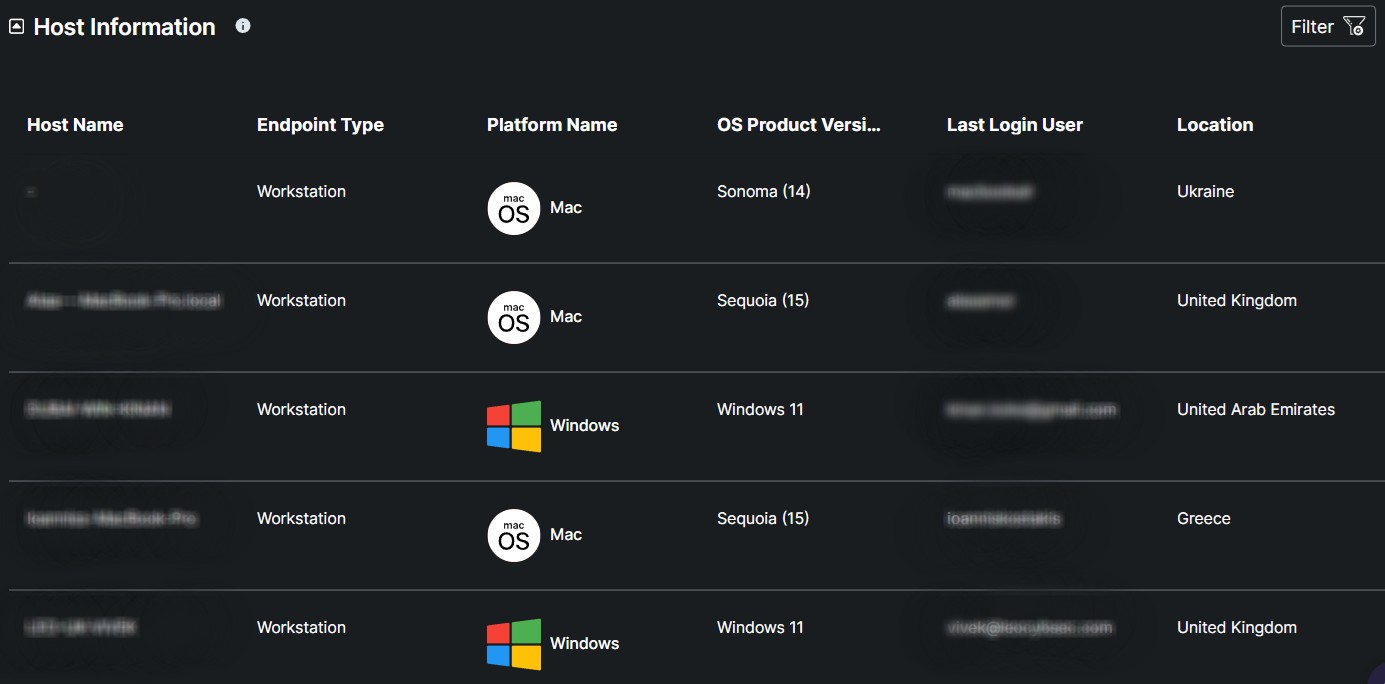
The Host Information table contains essential details about each monitored device, including the host name, product type, platform type, OS product version, last login user, and location, offering a comprehensive view for effective tracking and management.
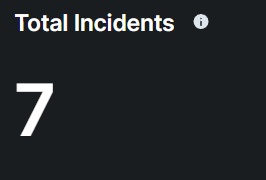
An incident refers to an event or occurrence that disrupts normal operations or poses a potential threat to the security and integrity of systems, data, or services.

The metrics represents the total number of incidents recorded over a specified period, providing a visual overview of security events or disruption
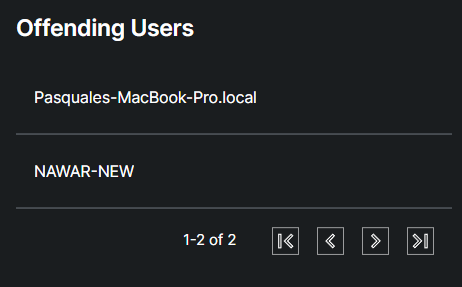
The table represents users who have triggered security alerts or violated security policies.
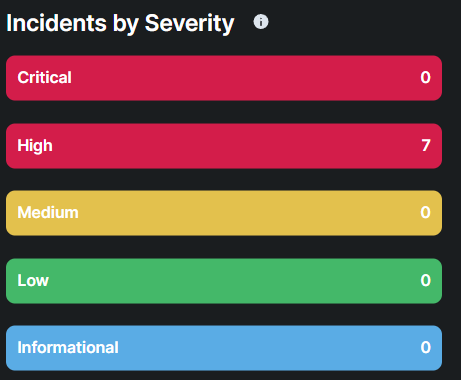
The "Incidents by Severity" categories help prioritize security efforts based on the level of threat:
Critical: These incidents represent the most severe threats. They indicate active breaches, such as confirmed malware infections, exploitation of vulnerabilities, or unauthorized access that has the potential to cause significant damage to systems or data. Immediate response is required to contain and remediate the threat.
High: High-severity incidents typically involve serious threats that could escalate if not addressed. These may include attempted intrusions, advanced persistent threats (APTs), or exploits that have not yet resulted in full compromise but pose a significant risk. Prompt action is advised to prevent escalation.
Medium: Medium-severity incidents are moderate threats that may not immediately endanger the network but require investigation. These could involve suspicious activities such as unusual file modifications or abnormal user behavior that could be indicative of a developing threat. Monitoring and further analysis are typically required.
Low: Low-severity incidents are often less critical and represent potential vulnerabilities or minor suspicious activities. These events may include benign anomalies or early-stage reconnaissance attempts. While they don't pose an immediate risk, they are still logged to ensure no potential threat is overlooked.
Informational: Informational incidents provide valuable insights into the security environment without indicating immediate or potential threats. These may include routine system events, status updates, or normal behavior observations, such as routine system maintenance logs or scheduled updates. While these events do not require action, they are useful for tracking system health and detecting any unusual deviations over time.
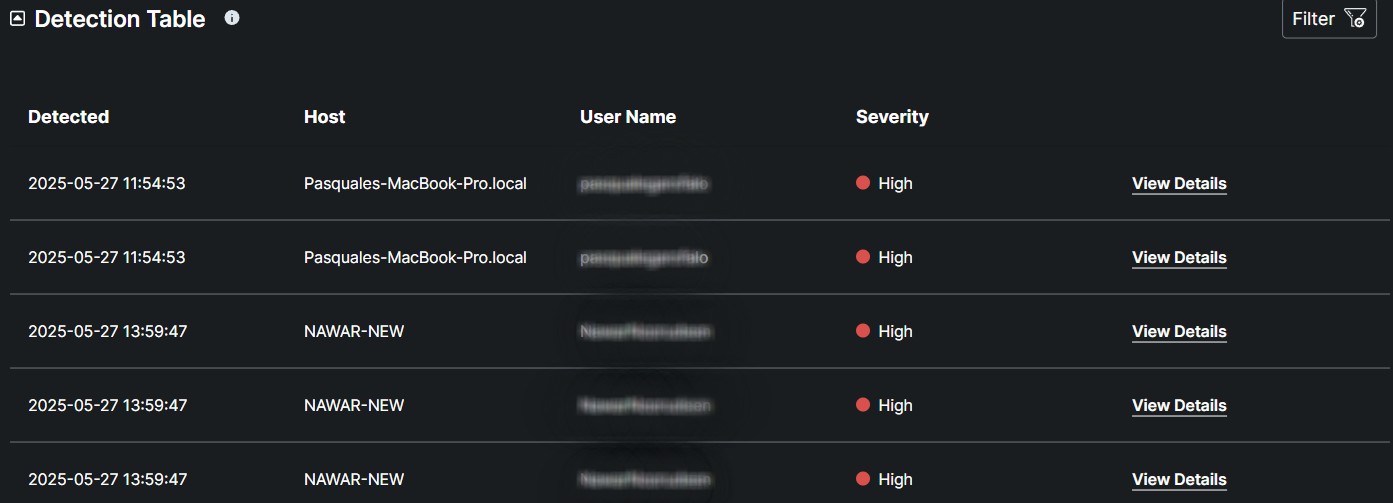
The Detection Table provides detailed information about each detected event, including the Host Name, which identifies the affected device; the Username, which indicates the user associated with the event; and the Severity, which classifies the threat's potential impact. Each record also includes a View Details button, allowing for deeper analysis and further action as needed.
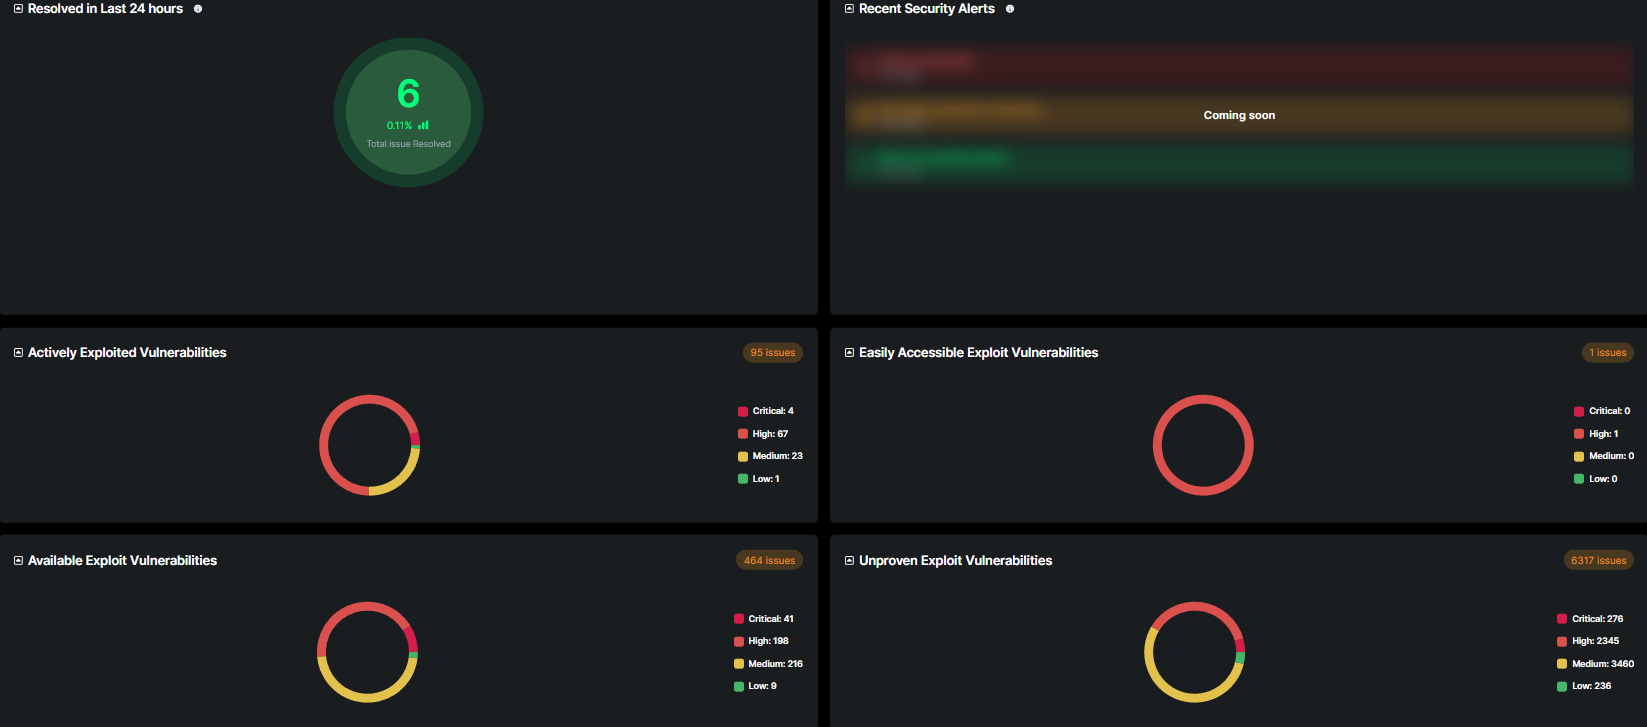
The Security Vulnerabilities Dashboard provides a consolidated view of the organization's current vulnerability and exploit landscape. It is designed to help security teams monitor, track, and respond to known threats efficiently by categorizing and visualizing relevant data points.
This section displays the total number of security issues that have been resolved within the past 24 hours. It includes both the count and a percentage to indicate resolution activity relative to the total issue volume.
This area is intended to display the latest security advisories, alerts, or notifications. It will highlight critical developments that require immediate attention. (Note: This section is currently under development and will be updated soon.)
Lists vulnerabilities that are currently being actively exploited in the wild. The section categorizes issues by severity (Critical, High, Medium, Low) and shows a total count. This helps prioritize response based on real-world exploit activity.
Highlights vulnerabilities for which exploit code is readily available and does not require sophisticated skills to execute. These are higher-risk from an accessibility standpoint and may be prioritized for mitigation.
Represents vulnerabilities for which public exploit code is available. While not all may be actively exploited, the availability of exploit tools increases the likelihood of use and requires timely remediation.
Captures vulnerabilities that are theoretically exploitable but have no verified public exploit. This section provides a broader view of potential threats and helps track overall risk exposure.
Each vulnerability section includes a donut chart with severity-based color coding:
🔴 Critical
🟥 High
🟨 Medium
🟩 Low
These visual elements enable quick status assessment and assist in prioritizing mitigation efforts across the team.
What is Endpoint vulnerability management?
Endpoint Vulnerability Management is the process of identifying, assessing, prioritizing, and remediating security weaknesses on endpoint devices such as desktops, laptops, servers, and mobile devices to reduce the risk of exploitation and ensure a secure IT environment.
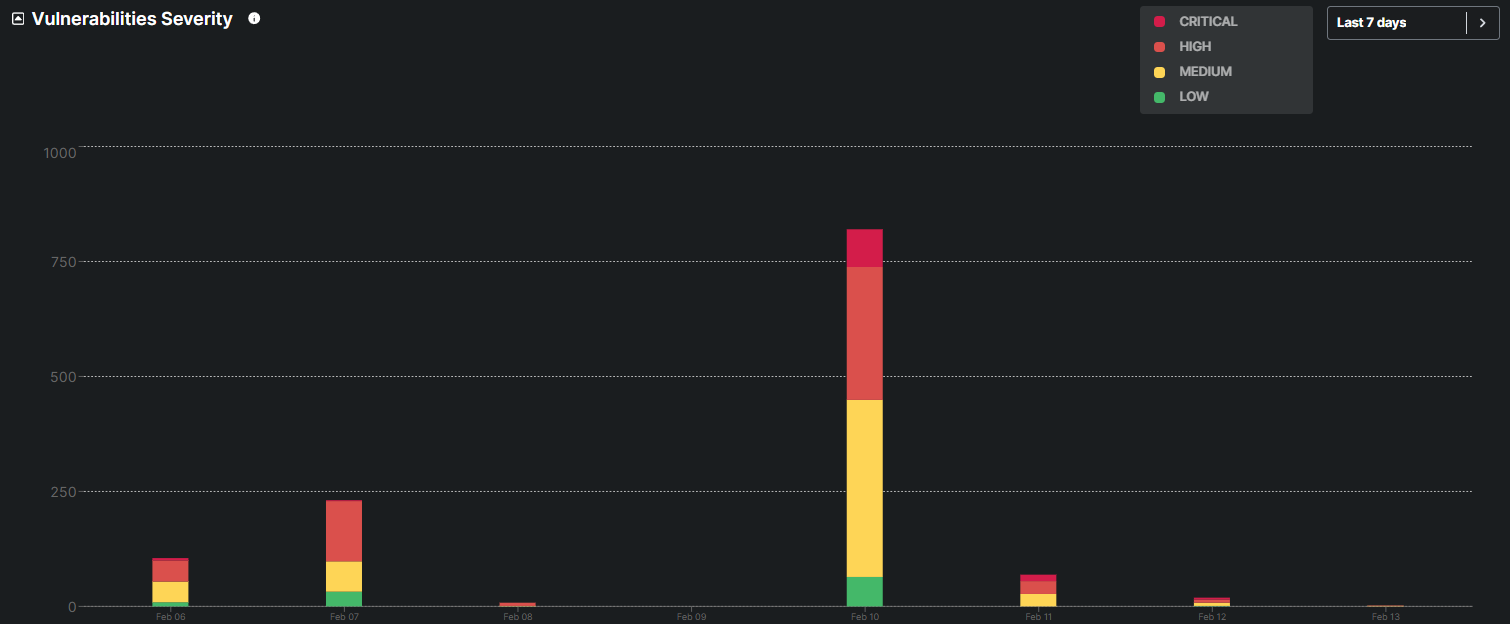
The graph displays the distribution of vulnerabilities classified as Critical, High, Medium, and Low over a specific period, helping prioritize remediation efforts based on the potential impact and urgency of each vulnerability.
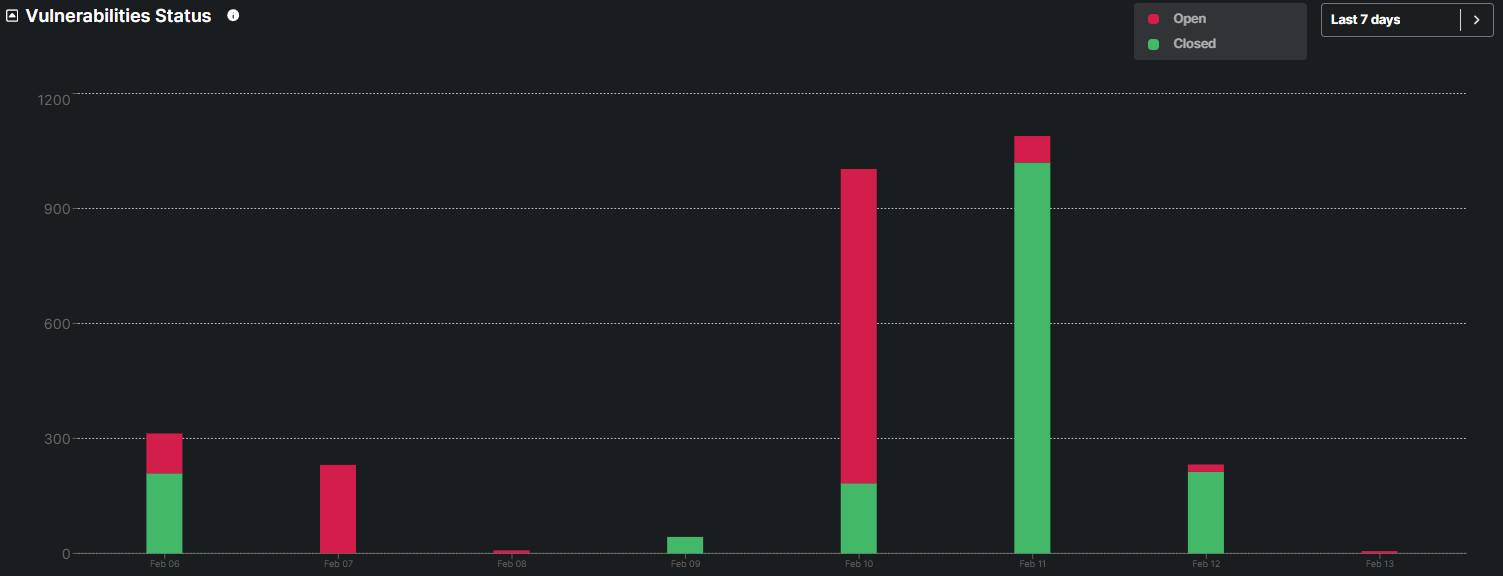
This graph categorizes vulnerabilities as Open or Closed, providing a clear view of remediation efforts and progress in addressing security issues and patches.
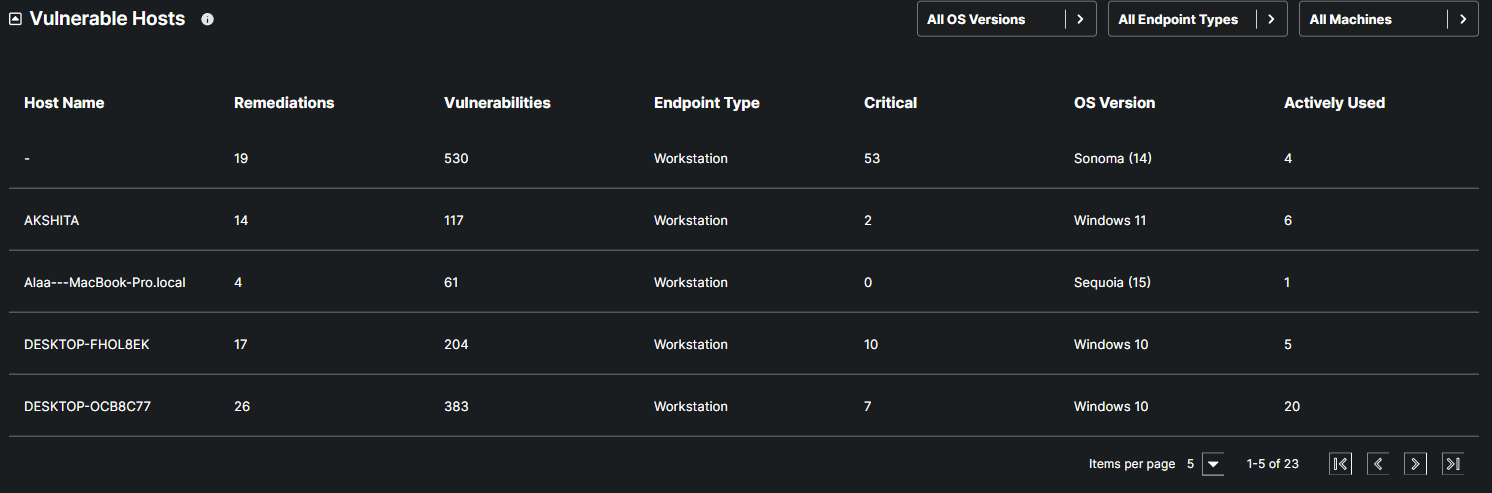
The Vulnerabilities Host table Provides insights on the hostname, Number of remediation available, and number of vulnerabilities for a specific host.
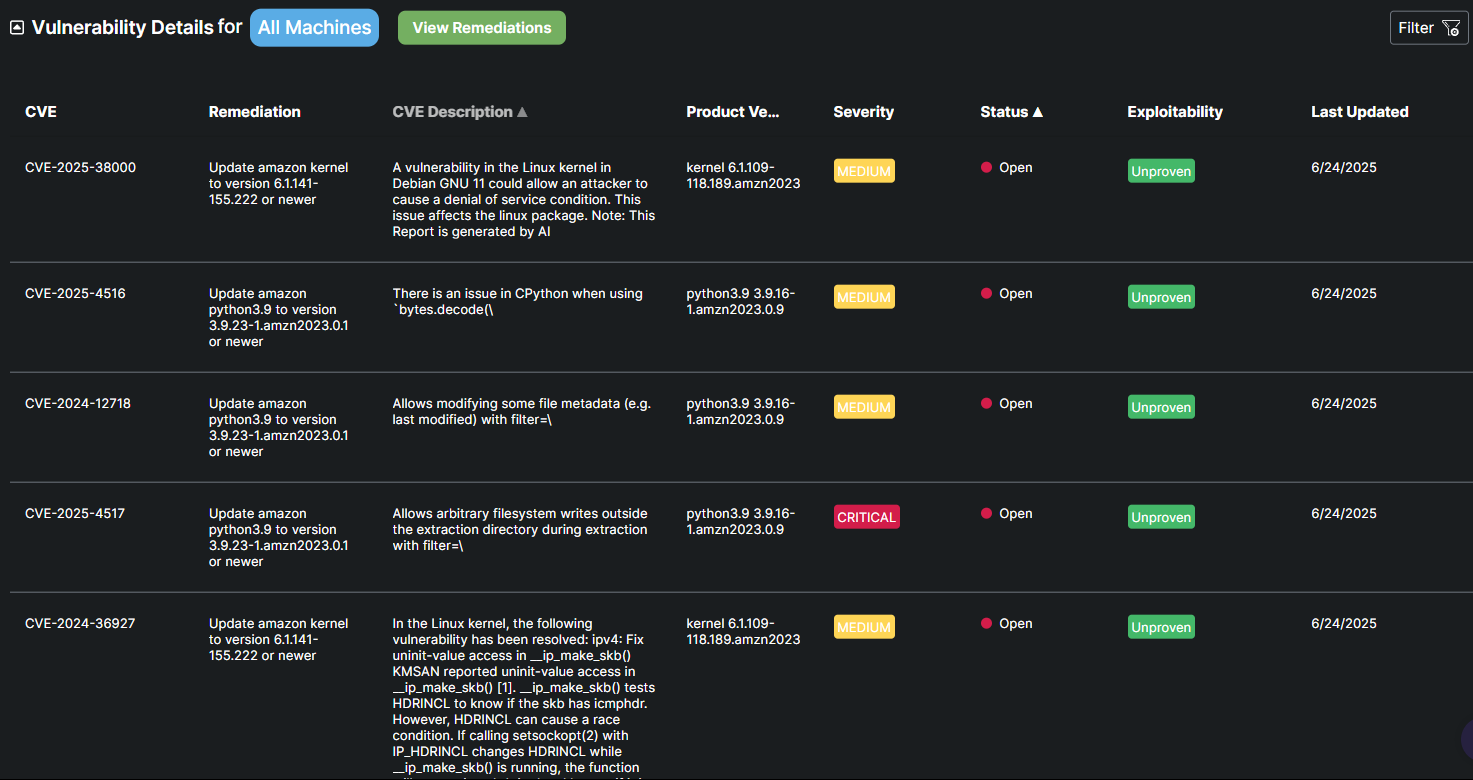
This table highlights specific vulnerabilities identified on a host. Each entry includes the CVE identifier for tracking the vulnerability, a description of the issue, recommended remediation steps, the severity level of the vulnerability, and the status (Open/Closed).
The dashboard allows users to filter remediations by individual workstations or view all outstanding remediations across all machines. This flexibility makes it significantly easier to identify, prioritize, and close out vulnerabilities in a more organized and efficient manner.